
Rice syrup production economics reach far beyond the number on a quotation sheet. 💰 Every ingredient decision carries economic consequences that ripple through formulation, labeling, allergen management, and brand positioning — and buyers who only compare price per ton routinely miss them. Understanding the full economics of rice syrup, from raw material cost drivers through formulation ROI, is what separates a commercially sound procurement decision from an expensive guess. Here are the five facts that matter most.
Where the Money Goes: The Raw Material Foundation
Rice Syrup Production Economics Starts With the Rice Grain
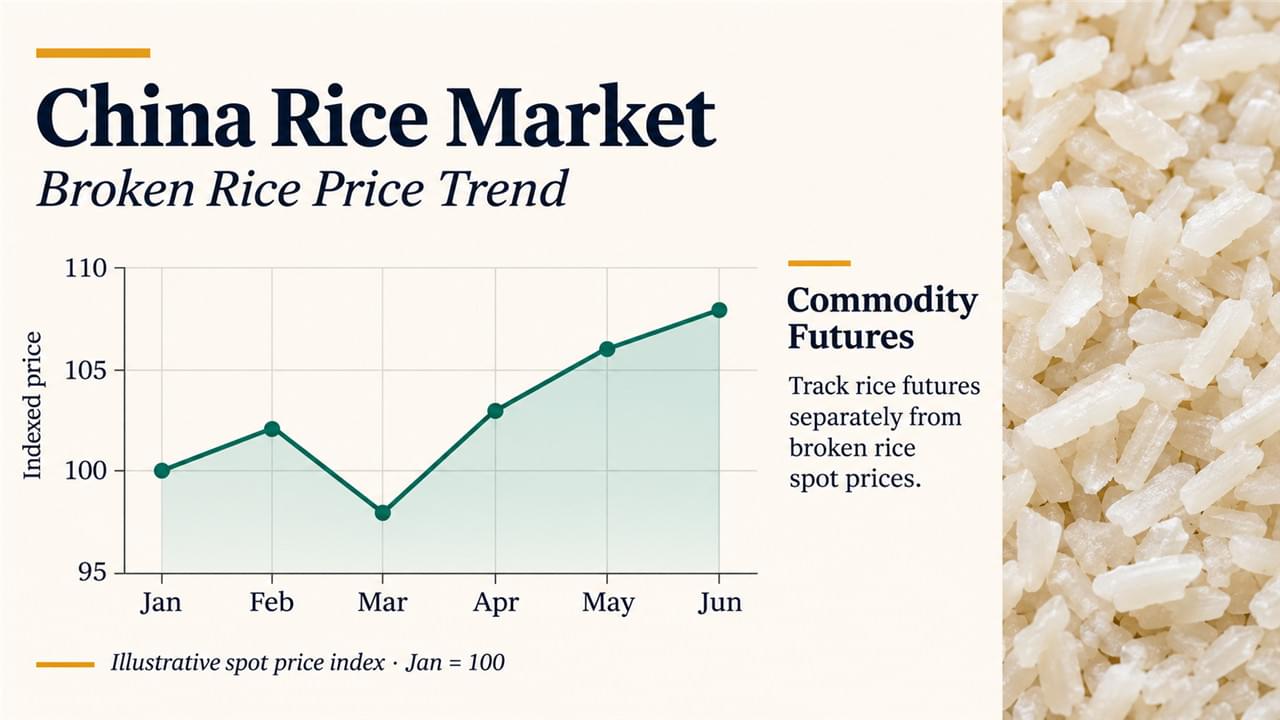
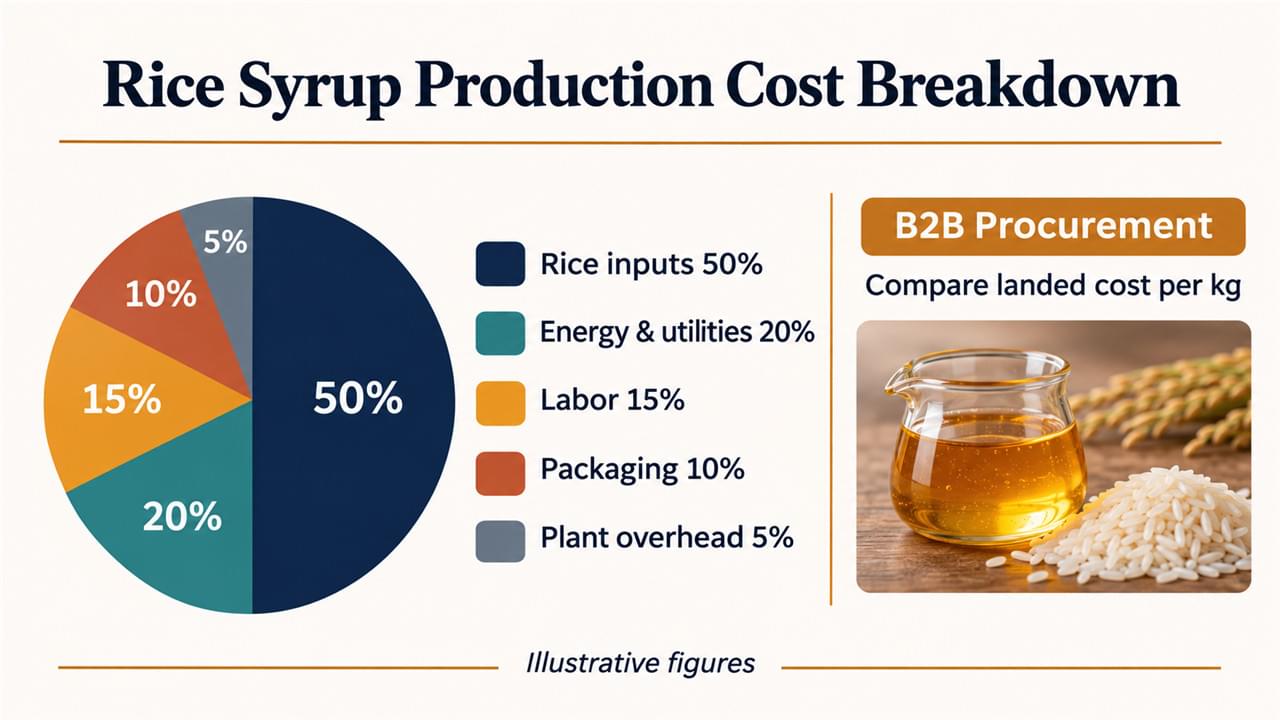
Rice grain represents 55–65% of total production cost, making it the dominant economic driver in any rice syrup cost analysis. 🌾
- China is the world’s largest rice producer, providing a deep domestic supply pool
- Manufacturers typically use “broken rice” — milling fragments — cutting raw material costs by 15–25% versus whole grain
- Broken rice is a byproduct stream put to productive use, which is both an economic and a sustainability win
- Rice prices have historically shown less volatility than corn, giving buyers a more stable raw material cost base
Buyers tracking commodity trends through sources like the USDA Economic Research Service gain useful context for timing large-volume purchases. 📈
The Full Rice Syrup Production Economics Cost Stack
Beyond raw material, the cost structure of rice syrup manufacturing breaks down roughly as follows:
| Cost Component | Approximate Share |
|---|---|
| Raw material (rice grain) | 55–65% |
| Energy (steam, electricity) | 12–18% |
| Labor | 5–8% |
| Enzymes (amylase, glucoamylase) | 3–5% |
| Processing aids (activated carbon, resins) | 3–5% |
| Packaging and logistics | 3–6% |
| Quality and certification overhead | 1–3% |
| SG&A and depreciation | 4–8% |
The evaporative concentration step is the single most energy-intensive operation. Modern multi-effect evaporator systems have substantially cut that energy bill compared with older designs — savings that responsible producers pass downstream. ⚙️
Rice Syrup Pricing: What Buyers Actually Pay
This is where rice syrup production economics gets concrete. Specification and volume both move the number on the sheet:
Specification Premiums and Volume Tiers in Rice Syrup Pricing
Rice syrup pricing rewards buyers who understand what they’re paying for:
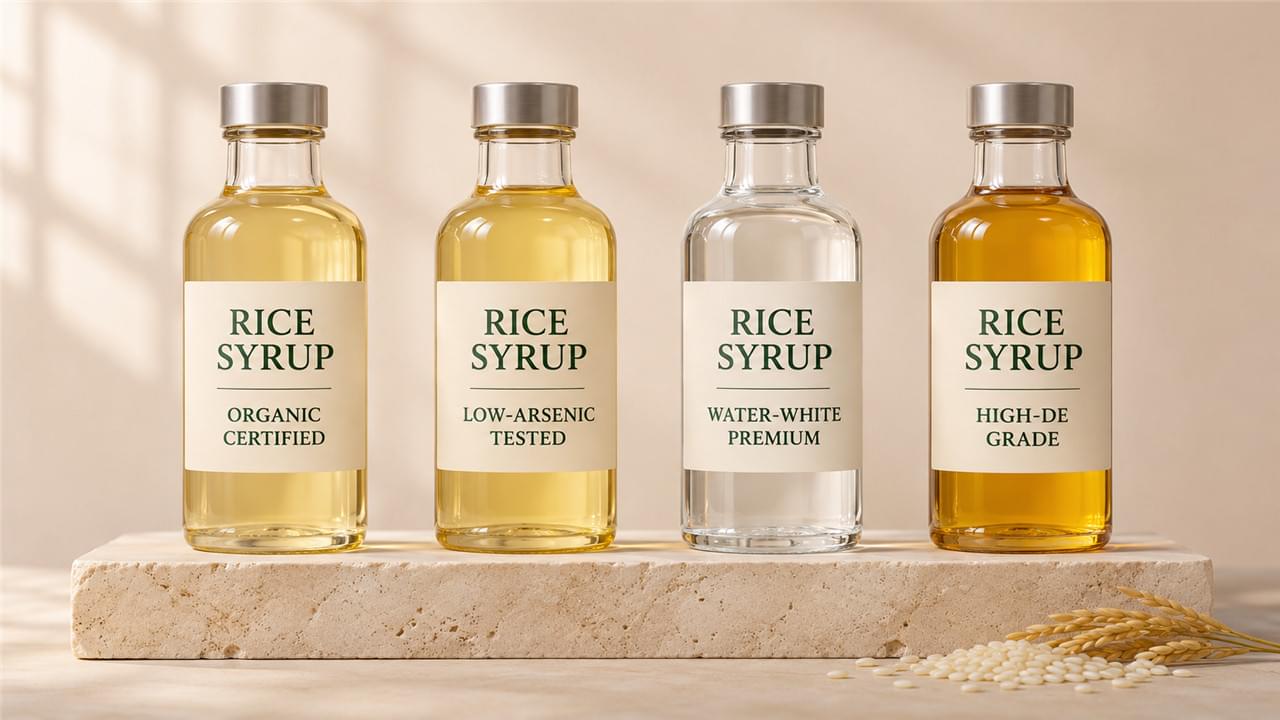
- Higher DE grades: small premium
- Water-white (low-ICUMSA) grades: premium of 5–15%
- Organic certified grades: premium of 20–40%
- Custom DE tolerance specifications: premium of 3–8%
Volume moves the needle too:
| Annual Volume | Pricing Tier |
|---|---|
| < 5 MT | List price |
| 5–20 MT | Standard commercial |
| 20–100 MT | Volume discount 3–8% |
| > 100 MT | Strategic volume pricing |
Total Cost of Use: The Hidden Half of Rice Syrup Production Economics
Purchase price per ton is a poor proxy for economic value. A serious total cost of use analysis accounts for what the syrup actually does in your product: 🧮
- Formulation yield: rice syrup at 80 Brix carries ~78–80% dry solids — you’re buying solids, not water
- Functionality credits: one ingredient delivering sweetness, binding, browning, and body simultaneously
- Label value: natural/clean label products command 10–30% retail price premiums
- Allergen management savings: rice syrup eliminates one potential allergen source from your facility and label
A syrup that looks 10% more expensive per ton can easily be cheaper per functional unit. That’s the whole game.
Reformulation ROI: When Switching to Rice Syrup Pays Back
Reformulation ROI: Rice Syrup Production Economics on the Brand Side
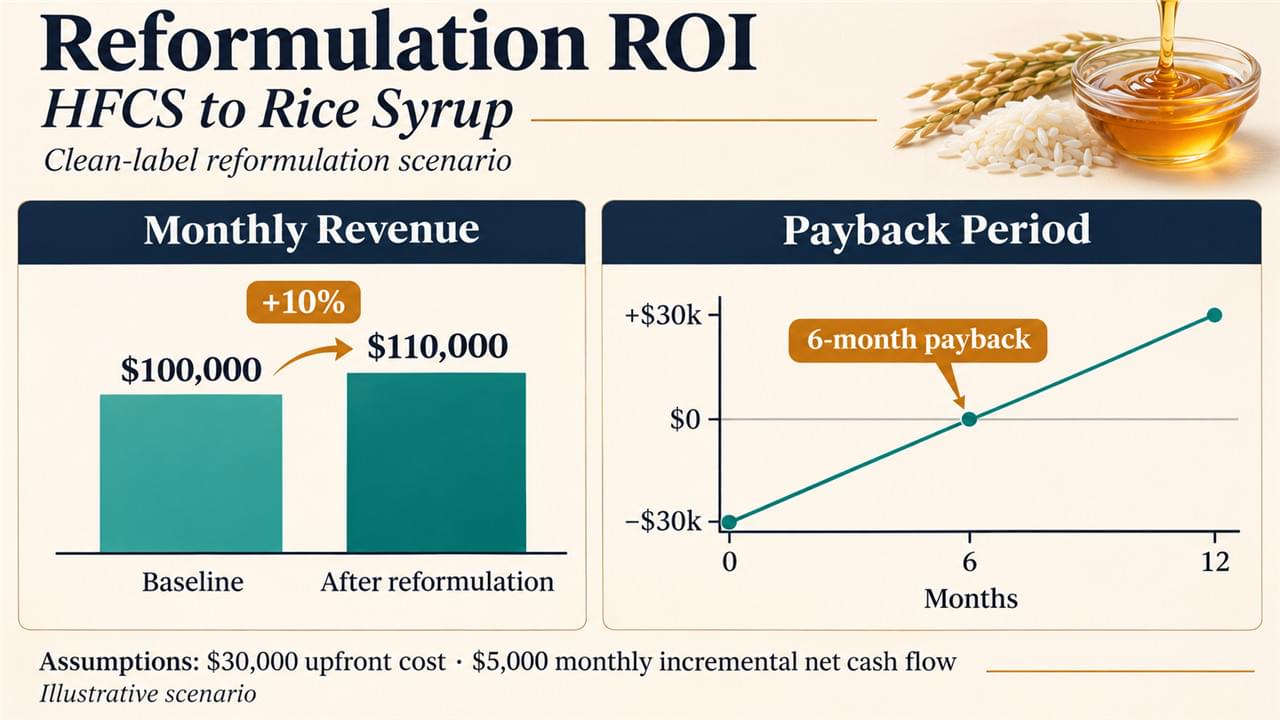
For brands reformulating from HFCS to rice syrup for clean label positioning, the math has two columns.
Investment costs: reformulation R&D, production qualification, regulatory review, marketing spend. 💸
Revenue benefits: retail price premium, new channel access, consumer acquisition, and reduced vulnerability to negative HFCS media coverage.
Well-executed clean label reformulation projects have demonstrated payback periods of 12–24 months. ⏱️ For a brand planning to live on retail shelves for decades, that’s a short wait for a durable positioning asset.
Supply Contract Economics: Locking In Your Advantage
Supply Contracts That De-Risk Rice Syrup Production Economics
Long-term supply contracts do more than fix a price:
- Price stability: fixed or index-linked pricing over 12–24 months reduces P&L exposure
- Supply security: contract commitments provide priority access during supply constraints
- Development incentive: committed volumes unlock supplier investment in custom grades
- Payment terms: established relationships typically unlock Net 30–60 terms
Buyers watching global commodity movements through the FAO Food Price Index can time contract negotiations with considerably more confidence. 🌍
Conclusion: Buy the Economics, Not Just the Syrup
Rice syrup production economics reward analytical rigor. Purchase price alone is inadequate — total cost of use, functionality credits, and strategic brand value must all enter the model. 🎯
Wuhu Deli Foods provides transparent pricing, volume tiering, and contract structure information to support your procurement analysis. Contact our team to run the numbers together.

 English
 Deutsch
 Español
 العربية
 Français
 Русский
 Bahasa Indonesia
 한국어
 日本語
 Polski
 Português
 Bahasa Melayu